Netbeans provides an easy environment for debugging or troubleshooting your Java applications. With netbeans debugger, you can step through the code line by line while viewing status of variables, threads and other informations. No need to add println() statements for finding problems that occur in your apps. Instead use breakpointss
Following things you can perform with Netbeans debugger
- step through application code line by line
- step through JDK source code.
- using break points, execute specific parts of code at a time
- track the value of a variable/expression.
- fix code on the fly and apply those code changes and continue the debugging session.
- options to suspend threads/execution at an exception.
- step back to the beginning of a previously called method. (pop a call in the current call stack).
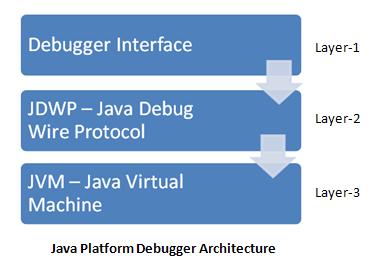
Java Platform Debugger Architecture
It has 3 layers, which provides the infrastructure for debugging applications.

Layer-1: high-level interface for debugging
Layer-2: format of information transfer
Layer-3: low-level native interface, applies code changes at jvm level.
Debugger Parameters
Netbeans debugger allows you to enable remote debugging to already running Java application. For this, you must run your application in debug mode, which requires below parameters.
-Xdebug -Xrunjdwp:transport=dt_socket, server=y, address=<<port number>>, suspend=n
Example:
java -Xdebug -Xrunjdwp:transport=dt_socket, server=y, address=65535, suspend=n
| Parameter |
Description |
| -Xdebug | enables the application to be debugged. |
| -Xrunjdwp | loads the reference implementation of the JDWP(Java Debug Wire Protocol), which enables remote debugging |
| transport | name of the transport to be used when debugging the application.dt_socket for a socket connection. |
| server | y – application listens for a connection at the specified address. n – application attempts to attach to a debugger at the specified address. |
| address | specifies a port number used for communication b/w the debugger and application. |
| suspend | n – application starts immediately. y – application waits until a debugger has attached to it before executing. |
Java Debug Wire Protocol(JDWP) – which defines the format of information and requests transferred between debugged application and debugger.
Attaching the Debugger to a running application.
From the main menu, select Debug -> Attach Debugger

Below window will pop-up.

Connector – select the appropriate connection type.
Transport – specifies JDPA transport protocol – automatically filled based on connector.
Host – Machine where the debugging application is running.
Port – Port number that the application listens on.
Timeout – durations that the debugger waits for a connection to be established.
Debugger commands.
Commands for debugging a java app.
F7 – step into – executes each source line , if it has method call, and source code is available, pointer moves to that method and executes it. otherwise pointer moves to the next line in the file.
F8 – step over – executes each source line without stepping through the individual instructions/commands.
F4 – run to cursor – execute the program from the current line.
F5 – continue – resumes debugging until it reaches a next breakpoint or exception or until the program terminates normally.
Setting Breakpoints
Breakpoint is a marker that you can set to specify where execution should pause when you are running your application in the IDE’s debugger.
with breakpoints you can,
- monitor the values of variables
- take control of program execution by stepping through code line by line.
- detect when an object is created.
- detect when the value of a variable is changed.
Fixing code during a debugging session.
Apply Code Changes – Its an useful feature. This can save lot of time, otherwise waiting for source to be rebuilt and restarting the server/debugging session.
It is useful for
- Fine-tune the code.(fixing minor issues)
- change the logic within a method.
This does not work for the following changes.
- add/remove methods or fields
- change the access modifiers of a class, method , field
- refactor the class hierarchy.
In simplest form, It should not accept the skeleton changes.
Note : Once restarted the server, applied code changes are not taking effect for next time because “Apply code changes” works on particular jvm instance only
For fixing code on the fly while debugging session, you must attach your application source code and jar files properly.
Advantages of using debugger
- Easily and quickly find and resolve the problem.
- Understand the flow of your application code is easier